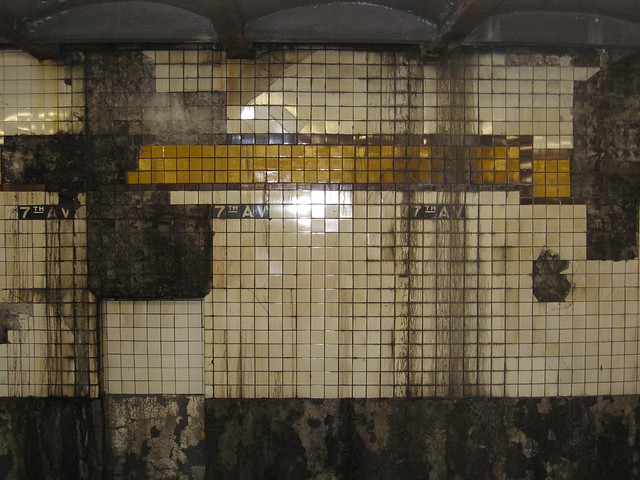
Archive for Straphangers Campaign

Transportation Alternatives' Paul Steely White unveils the Schleppie Award while Gene Russianoff looks on. (Photo courtesy of Kim Martineau/Transportation Alternatives)

If you’re trying to get across 42nd St. in a hurry and the M42 is on the horizon, you’re better off walking. At least that’s the message the Straphangers Campaign and Transportation Alternatives had for the city’s transit riders as they unveiled the annual Pokey and Schleppie Awards for the New York’s bus routes today.

Maintaining an average rate of just 3.6 miles per hour during the noontime run, the M42 captured the Pokey Award, the Straphangers’ recognition for the system’s slowest bus. It is the second consecutive year this midtown route has taken home the trophy. For anyone young enough and healthy enough, it is indeed possible to cross Manhattan on foot faster than the M42 covers it on wheels.

The Straphangers and TA also unveiled the slowest routes in the other four boroughs as well. Taking home the honors were the B35, the Bx19, the Q58 and S42. Still, none of those buses can hold a candle to the M42. Each maintains speeds above 5 mph, and the S42′s 8.2 mph velocity might be slow for Staten Island but would be considered speedy along the streets of Manhattan.

As for the Schleppie, a nod for the system’s “least reliable” bus, the Bx41, the system’s 15th most popular bus route, took home the award. The Straphangers had more on the unreliable local buses:

Almost one in four Bx41 buses — 23.5% — arrived bunched together or came with big gaps in service during the first half of 2010. Last year’s “winner” with the worst reliability was the B44, which runs between Williamsburg and Sheepshead Bay, Brooklyn.

The groups noted, however, that the number of unreliable buses had more than doubled in the past year. MTA New York City Transit measures a “borough-representative sample of 42 high-volume bus routes” for unreliability. In the first half of 2009, the groups found four routes out of those 42 had more than one in five buses arriving off schedule. However, that has grown to 11 routes in the first half of 2010.

The most unreliable bus routes in each of four boroughs with over 20% of buses bunched together or big gaps in service are:

  • B44: 21.7% unreliable btw Sheepshead Bay and Williamsburg on Nostrand Avenue
  • Bx41: 23.5% unreliable btw Wakefield and The Hub on White Plains Rd/Webster Ave
  • M101/2/3: 22.3% unreliable btw Upper and Lower Manhattan on 3rd and Lexington Avenues
  • S78: 21.8% unreliable btw St. George Ferry and Tottenville on Hylan Boulevard

While local buses remain among the worst forms of surface transportation in the city, TA and the Straphangers acknowledged the MTA’s Select Bus Service plan. It’s taken a painfully long time to get Select Bus routes off the ground, but riders are noticing improvements.

“The next generation of buses is making inroads in New York City — Select Bus Service can cut travel time for riders,” Paul Steely White, executive director of Transportation Alternatives, said. “Where these fast buses have been tried in the Bronx, travel times dropped at least 20 percent. Similar improvements were recently installed on Manhattan’s East Side. Rather than pokey and schleppie buses, New Yorkers deserve quick and efficient bus service. We are encouraged by the city’s willingness to make New York’s buses work better.”

Eventually, as the MTA replaces the MetroCard with a contactless payment technology, bus load times will improve, and bus speeds should improve. Still, though, bus stops are much too close together, and the lack of lane and signal priority means that buses will forever be at the whims of surface conditions. Until bus routes are cleared, pokey and schleppy will be a perfectly adequate description of New York City bus service.

For more on the awards and the Straphanger’s methodology, check out their press release. After the jump, a vide on the awards from Streetsfilms. Read More→

Comments (12)

The 7 train — favored by John Rocker and urban anthropologists everywhere — is the city’s top subway route, according to the annual State of the Subway Report released this morning by the Straphangers Campaign. For the second year in a row and sixth time out of the previous 13, the IRT Flushing route leads the pack while the C train, that sad 8th Ave. local, has been rated the worst for the third year running and by no small margin.

The State of the Subways Report Card, an annual release since 1980, tracks each line along six measures, and this year, with a decade and a half of heavy investment in new rolling stock behind us, the Straphangers found that trains breakdown less frequently, are cleaner and feature more intelligible on-board announcements. “This positive trend reflects the arrival of new model subway cars and better maintenance of Transit’s aging fleet,” the Straphangers said in their report. However, the regularity of service across the subway lines varies dramatically though, and riders still struggle to find seats during peak hours.

On a scale based off of a swipe of a subway ride with $2.25 being the highest, the 7 earned a $1.60 rating, with the L right behind it at $1.45. “The 7 ranked highest,” said the report, “because it performs best in the system on subway car cleanliness and above average on four measures: frequency of scheduled service, regularity of service, delays caused by mechanical breakdowns, and seat availability at the most crowded point. The line did not get a higher rating because it performed below average on announcements.”

The C train, meanwhile, earned just a $0.55 rating while the 2, D and R trains tied for second-worst but with ratings of $0.90. “The C line performs below average on five measures: amount of scheduled service, delays caused by mechanical breakdowns and announcements (all three next to worst); regularity of service; and cleanliness,” explained the Straphangers. “The line performed better than average on one measure: chance of getting a seat at rush hour.”

As I complain every year, the Straphangers still release their reports as PDF files instead of web pages with tables. So to view the full line-by-line results, you’ll have to check out their four PDF files (line ratings, table of results, best and worst and historical rankings. I’ll break down the findings though.

The Straphangers, often tough critics of the subway system, praised the MTA for its improvements on breakdowns, cleanliness and in-car announcements. They report notes:

  • The car breakdown rate improved from an average mechanical failure every 134,795 in 2008 to 170,314 miles in the 12-month period ending May 2010 — a gain of 26%. This positive trend reflects the arrival of new model subway cars and better maintenance of Transit’s aging fleet. We found sixteen lines improved (3, 4, 5, 6, 7, B, E, F, J/Z, L, M, N, Q, R, V and W), while five lines worsened (2, A, C, D and G) and one stayed the same (1).
  • Subway cars went from 91% rated clean in our last report to 95% in our current report. We found that twenty lines improved (1, 3, 4, 5, 6, 7, A, B, C, D, E, F, G, L, M, N, Q, R, V and W) and two worsened slightly (2 and J/Z).
  • Accurate and understandable subway car announcements improved, going from 90% in our last report to 91% in the current report. This likely reflected in part the increasing use of automated announcements on ’new technology“ cars. We found eleven lines improved (1, 3, B, D, E, F, G, J/Z, L, Q and W), five worsened (2, 6, 7, R and V) and six did not change (4, 5, A, C, M and N).

In terms of how various subway lines performed, the Straphangers offered up these top-line observations:

  • Breakdowns: The M had the best record on delays caused by car mechanical failures: once every 1,045,886 miles. The G was worst, with a car breakdown rate sixteen times higher: every 60,039 miles.
  • Cleanliness: The 7, L and V were the cleanest lines, with only 1% of cars having moderate or heavy dirt, while 11% of cars on the dirtiest lines — the J/Z and R — had moderate or heavy dirt, a rate more than ten times higher.
  • Chance of getting a seat: We rate a rider’s chance of getting a seat at the most congested point on the line. We found the best chance is on the B line, where riders had a 68% chance of getting a seat during rush hour at the most crowded point. The 2 ranked worst and was much more overcrowded, with riders having only a 27% chance of getting a seat.
  • Amount of scheduled service: The 6 line had the most scheduled service, with two-and-a-half minute intervals between trains during the morning and evening rush hours. The M ranked worst, with ten-minute intervals between trains all through the day.
  • Regularity of service: The J/Z line had the greatest regularity of service, arriving within two to four minutes of its scheduled interval 93% of the time. The most irregular line is the A, which performed with regularity only 83% of the time.
  • In-car announcements: The 5, E, L, M and W lines had a perfect performance for adequate announcements made in its subway cars, missing no announcements, and reflecting the automation of announcements. The R was worst, missing announcements 25% of the time.

The Straphangers say they publish this report every year because the MTA is hesitant to release broad report cards of their service. Howard Roberts’ Rider Report Cards went the way of the dodo after one and a half cycles, and the Straphangers have continued to push Transit for information on how trains perform. Lately, the authority has released more data about on-time rates and the like, but nothing as comprehensive as the Straphangers’ efforts have emerged from Transit. “We hope,” the advocacy group said, “that these efforts — combined with the concern and activism of many thousands of city transit riders — will win better subway and bus service for New York City.”

Postscript: The data in this year’s report still includes the V and W lines because the Straphangers conducted their survey before Transit implemented the June service cuts. Next year’s report will show the impact the cuts had on the system. For an entertaining look back at a system vastly improved, check out WNYC’s unearthing of the 1985 State of the Subways report. Today, we worry about litter; twenty five years ago, we worried about broken doors and cars with working lights.

Comments (7)

As part of its budget-paring efforts, New York City Transit has allowed its system’s cleanliness to slip. Fewer cleaners are available to tend to stations and subway cars, and work shifts that are empty due to sick days are often left unfilled so that the authority does not need to pay out overtime. As such, the trains have become dirtier, a new report issued today by the Straphangers Campaign says.

The annual report, entitled the Shmutz Survey, found that only 50 percent of all subway cars were considered “clean” in 2009. That total represents a seven-percent drop from 2008. “It’s as clear as the grime on a subway car floor: MTA Transit cuts in cleaners has meant dirtier cars,” Gene Russianoff, campaign attorney for the Straphangers, said. “And more cuts to come means more dirt for subway riders.”

For those along Sixth Ave. looking forward to impending M train service from Middle Village to Forest Hills, the news is even worse. Cars along the M were rated the dirtiest with only 32 percent checking out as clean. On the other hand, those in use along the C and 6 lines were the system’s cleanest. A whopping 65 percent of cars along those two lines were deemed clean.

But what exactly does it mean for a car to be clean? According to the Campaign, workers examined the cleanliness of train cars at various times during the day from September to November. The campaign checks the floors and seats but does not account for litter. A “clean” rating means that cars were, according to guidelines, “basically dirt free” or had “light dirt” (“occasional ‘ground-in’ spots but generally clean”). Cars are not clean if they are “moderately” dirty with a “dingy floor [or] one or two sticky dry spots” or “heavily” dirty with “any opened or spilled food, hazardous (e.g. rolling bottles), or malodorous conditions, sticky wet spots, any seats unusable due to unclean conditions.”

The Straphangers’ findings clash with Transit’s own internal metrics. While the Straphangers found a deterioration in cleanliness, Transit’s own data found that 95 percent of cars — up from 91 percent in 2008 — were clean. The two sides could not pinpoint why such a great discrepancy between the two figures existed, but the MTA has long disputed the Straphangers’ methodology.

No matter the differences, the Straphangers urged the MTA to monitor the reductions in resources available for subway car cleanliness, and Transit, in a statement, acknowledged how its own financial troubles have led to dirtier trains. “With the current budget challenges being faced by MTA New York City Transit, we acknowledge that some subway car floors may not be as clean as our customers expect or deserve,” the agency said. “However, we will monitor conditions and shift forces as necessary. We also take the opportunity to remind customers to pitch in and help keep the subway as clean as possible by utilizing proper refuse receptacles.”

The last point is one worth examining. It’s true that the declining numbers of available cleaners will inevitably lead to dirtier cars and stations, but the riders themselves are part of the problem. As I wrote in April, many riders treat the subway car floors as their own personal garbage cans. If people were more mindful of their garbage, if they carried out what they carried in and didn’t spill food or drinks on the floor — in fact, if eating weren’t allowed in the subways — the trains would simply be cleaners. Perhaps in an era of fewer cleaners, that’s the way to keep the trains tidy.

After the jump, a list of findings from the Straphangers’ Shmutz Survey. For more on the cleanliness of subway cars, check out the two PDF tables attached to the report (1 and 2). Read More→

Comments (3)

Holding Lights

The holding lights might be on, but who knows why? (Photo by Benjamin Kabak)

When it comes to on-board public address systems, Transit just can’t win. Sometimes, the train announcements are non-existent or inaudible. Other times — the new R160s come to mind — the announcements are deafeningly loud, repetitive and downright uninformative. In a city that prides itself on its collective ability to complain about everything, subway train announcements are right there at the top of the list.

But what if the train announcements aren’t there when they need to be? What if straphangers have no idea why a train is delayed, where Transit may be rerouting them or how a potential emergency could impact a commute home? According to a recent study issued by the Straphangers Campaign, that is exactly the problem underground. While regular announcements are generally audible, those concerning delays are hard to hear, if they’re even uttered at all.

According to the report, 80 percent of the so-called “basic announcements” are “clear and accurate.” Yet, 55 percent of announcements regarding delays and service disruptions face problems. The report say the statement from the conductor was “inaudible, garbled or incorrect.” Transit requires an announcement at the time of the delay and again two minutes later. It is, then, discomforting to know that nearly half the time, no announcement is made.

“We’re glad basic subway car announcements are improving, but disappointed most riders are being left in the dark to cope with delays and reroutings,” said Cate Contino, Campaign coordinator who oversaw the survey.

Not surprisingly, the line-by-line breakdown shows a clear dichotomy between the newer cars with their prerecorded announcements and the older rolling stock still in service. On the 6 and the M, the Straphangers’ ratings claimed to hear “clear, ungarbled and correct” announcements 100 percent of the time

The 4, 5, 6, L, M and N lines performed the best in making basic announcements. Our raters heard basic announcements that were clear, ungarbled and correct for a perfect 100% of the time on the 6 and M; all the top-performing lines had automated announcements and performed perfectly or near perfectly. The 4, 5, L and M all had scores of 98 percent or higher. The D, G and 7 lines performed the worst with marks of 61 percent for the G and 62 percent for the D and 7. When I ride the D, I hear station announcements sometimes, and the absence is notable.

Transit issued a brief statement in response to the Straphangers’ report. “We are continuing the effort to improve communications with our customers in all areas, including announcements made on board trains,” the agency said. “While the inclusion of digitized voice announcements on our newer subway car classes has made a huge difference in the announcement quality, we are also working to make certain that train crews keep customers informed when issues arise that may affect their trips.”

This is one of those areas where the MTA’s technology will eventually catch up with the needs and demands of the riders, but even then, people will be unhappy. Is it better to know why the train is sitting in a tunnel for 25 minutes by being bombarded with reminders and automated messages every 120 seconds or are we better off, literally and figuratively, in the dark? It’s important for rider sanity and safety to keep all informed of the goings-on underground, but after hearing for the umpteenth time that the MTA is “apologizing for the unavoidable delay,” I almost yearn for those cars with inaudible announcements.

Comments (13)

The word “straphanger” remains an archaic and anachronistic slang for subway riders. Coined in Chicago among the El trains in the 1890s, the phrase was a reference to those who ride trains while standing up and had to hold onto leather straps for balance. New York had cooped the slang in the early 1900s, and the name lives on most famously in conjunction with the Straphangers Campaign. In fact, 1969 was the last year subway cars featured straps in the city, and now, they live on only in the Transit Museum’s vintage cars.

Today, we can eulogy the last vestige of straps in the city. As Heather Haddon reports, the last of the leather straps have been removed from the Roosevelt Island tram. We now have stainless steel bars for balance, and true straphanging is no more. And thus another part of New York City transportation history will live on, as the IRT, BMT and IND do, as a reference to a bygone era.

Comments (9)

When an eleventh-hour Albany bailout package earlier this year ensured that the MTA would not need to institute its original Doomsday budget proposal, I ran something of a postmortem on the transit advocates’ roles in the debate. In a rather scathing piece that generated strong feelings on both sides of the divide, I questioned the Straphangers’ approach toward their advocacy campaign and wondered if they were truly taking advantage of their position as the city’s leading — and sometimes only — transit advocacy group.

Since then, the Campaign has seemingly taken a more vocal role in trying to educate the public. Gene Russianoff has been quick to point out that the payroll tax short fall is entirely Albany’s fault, and he has, for better or worse, proposed alternate ways the MTA could close its budget gap without cutting too many services.

But an e-mail I received yesterday made me raise an eyebrow or two. First, it starts out saying, “For the MTA, reviving these cuts would shred its credibility.” Of course, it’s not for another three paragraphs that the Straphangers accuse Albany of not doing its job. Perhaps the MTA does lose its credibility, but who should lose more credibility — the agency tasked with balancing its budget or the state legislature whose empty promises have left the authority nearly broke? I still believe the better strategy for a transit advocacy group is to educate and not to finger-point at the agency that has few options available to it.

It gets better though when the Straphangers bring math into the equation:

Riders have every right to be mad as hell ­– and parents furious. Ending full-fare and half-fare discounts for 550,000 students in New York would be a huge financial burden on families. For example, it would cost a parent at least $1,069 annually to pay to get their full-fare child to school (280 school days x $1.91 x 2. A $1.91 represents 15% off $2.25, the current base fare.) $1069 equal to the costs of a 30-day pass for an entire year!

Now, first, the Campaign’s math is simply wrong. I use a 30-day card every month, and the totally yearly cost to me is $1068. I might be picking a bone over one dollar, but it’s just sloppy multiplication. That’s not the real problem though; the real problem is one of simple common sense. If, as the Straphangers contend, it will actually cost less to buy 30-day passes for a year than it will to pay the full fare everyday for 280 school days, wouldn’t parents just, you know, buy 30-day passes for their school-bound children? So much would it actually cost to send two children to school for 280 days? Let’s find out.

One 2010-2011 school year calendar I’ve seen has school beginning on Monday, Sept. 13 after the Jewish holidays. Students are then in school through Dec. 17, return on Jan. 3, have a week off in both February and April and see the year wrap up around June 17. The fall semester, then, would cover three unlimited ride MetroCards plus five days of paying the full fare. The spring semester would require five unlimited ride MetroCards and another two-week MetroCard plus five days of the full fare. How’s the math look?

(8*$89)+$51.50+(10*$1.91*2)=$801.70

But there’s a further problem: There aren’t 280 school days in the calendar year. There are approximately 180 school days in New York City. The math for a full-fare ride for the actual school year looks like this:

180*$1.91*2=$687.60

No matter how you slice or dice, for many families, that figure will still look expensive. Some who use transit on the weekends will opt for the $800 approach; others may stick with the $687 figure. No matter the cost, it will be a burden to spend those additional hundreds of dollars on student transportation costs, and after enjoying free rides for years, parents will experience an element of sticker shock here.

But my main point is that the Straphangers should be presenting an honest expense figure here. It will cost between $687 and $800 to send one student to school for the entire school year, excluding summers. The public deserves to know that, and the Straphangers, a ridership advocacy group, should not be releasing widely inflated figure as they did yesterday.

Amidst news of upheaval at New York City Transit and some changes atop the MTA management structure, the Straphangers Campaign announced its latest awards for New York City’s much-maligned bus system. The group closed with calls for bus reform as new MTA CEO and Chair Jay Walder looks to improve the city’s surface transit options.

As has become an annual tradition, the Straphangers doled out awards for the slowest bus and the least reliable bus. This year, the group added an award for the bus with the longest scheduled run time end-to-end. This award could be bolstered with a distance comparison amongst bus lines, but it certainly underscores the absurdities of taking buses in New York City along certain routes.

The slowest bus this year is again a crosstown bus in Manhattan. The M42 was clocked at average speeds of 3.7 mph at noon on a weekday as it ventured across the busy thoroughfare. “The M42,” the Straphangers press release said, “would lose a race with a five-year-old riding a motorized tricycle with a speed of 5 mph, as advertised by X-Treme Scooters.”

This year, the group also highlighted slow buses in the Outer Boroughs. Averaging just 5.1 miles per hour, the B63 was Brooklyn’s slowest. The Bronx’s Bx19 averaged 4.9 mph while Queens’ Q56 reached 6.3 mph, still slowing than my average running pace over five miles. Staten Island’s S42, the slowest of that borough’s buses, was downright speedy at 10.6 miles per hour.

The Schleppie, an award for the bus with the least reliable service, went to a Brooklyn-based route. The B44 “arrived bunched together or came with big gaps in service” 21.7 percent of the time, according to official Transit statistics. The M15 took home the title for Manhattan.

Finally, the group handed out the Trekkie to the M4. This bus runs from Penn Station to Fort Tryon, a route of approximately 11 miles, and is schedule to take an hour and 50 minutes. As the Straphangers note, Amtrak from Penn Station arrives in Philadelphia, 99 miles away, in at most an hour and 27 minutes.

The real meat of the report, though, comes at the end when the Straphangers talk about speeding up buses. “The only way to stem the tide of falling bus speeds is by giving buses more priority on the street than the rest of traffic,” Paul Steely White, executive director of Transportation Alternatives said.

In effect, the MTA and NYCDOT need to implement a few key upgrades to improve bus service. A pre-board fare payment system or a contactless mode of payment would greatly enhance bus loading efficiency. A system of physically separated bus lanes with priority signaling would do wonders for New York’s buses. Finally, enforcement of bus lanes should be a priority as well.

These options are not revolutionary. They are in place in numerous countries and cities around the globe, and Walder should pursue them as low-cost, high-result techniques for improving bus service. The MTA, too, knows this and in a statement responding to the survey, discussed new approaches to buses:

Buses were introduced to New York City more than 100 years ago and despite being, by far, the most efficient vehicles on rubber tires as far as the numbers of people they carry, they are still forced to vie for the same street space as a single-occupant automobile. However, with recent innovations such as Select Bus Service (SBS) and signal light prioritization, as well as plans to further improve service recently outlined by MTA Chairman and Chief Executive Officer Jay H. Walder, it is important for the city’s 2.3 million bus customers to know that we are working to achieve improvements in bus speeds and reliability.

Future plans call for the eventual expansion of SBS routes, new methods of fare payment, stricter bus lane enforcement, the use of cameras to nab offenders and the development of a reliable system offering next bus information to waiting bus customers. Since the start-up of SBS, travel times across the Bronx route have been reduced by 20%, ridership has increased, and an overwhelming majority of customers have indicated that they are satisfied or very satisfied with the service.

Better bus service for all. It’s a simple mantra easy to implement and with obvious immediate benefits. Let’s see it happen.

Comments (11)

Yesterday afternoon, I offered up a short piece and a link to the Straphangers Campaign annual state of the subways report card. I didn’t have time then to really drill down on the findings and offer up my critique of the survey. So let’s jump in now.

First up were the Straphangers’ various findings. You can see the tables of subway grades on the report’s site. Unfortunately, they’re available only as PDFs and not, in 2009, as online tables. Anyway, technology gripes aside, the top-line findings:

  1. The best subway line in the city is the 7 with a “MetroCard Rating” of $1.55
  2. The L came in second behind the 7 with a MetroCard Rating of $1.50.
  3. Both the L and 7 are in a “line general managers” program, which has promise to improve service.
  4. The C was ranked the worst subway line, with a MetroCard Rating of 50 cents.
  5. Overall, we found a mixed picture for subway service on the three measures we can compare over time — car breakdowns, car cleanliness and announcements.
  6. There are large disparities in how subway lines perform.

Those last two points in the survey require some further digging. Both in that top-line summary and in the subway line profiles, the Straphangers reveal widely divergent results without explaining they whys of it.

They only time, in fact, that they do explain why is in point three. The 7 and L performed better because the pilot program for the Line Managers had more resources available than the rest of the subway lines currently enjoy or will have in the future. In that regard, the Straphangers’ assessment doesn’t consider how Transit has seemingly weighted any line analysis in favor of a pilot program for which they wanted full approval.

In discussing points five and six, the Straphangers offered up some numbers. We’ll focus on two of them:

  • The car fleet breakdown rate worsened from an average mechanical failure every 149,646 miles in 2007 to 134,795 in 2008 — a drop of almost 10%. This is a bad trend, raising questions about the condition and maintenance of the aging transit fleet. We found: fifteen lines worsened (1, 3, 4, 5, 6, 7, A, C, E, F, G, L, Q, R and V), while seven lines improved (2, B, D, J/Z, M, N and W).
  • Accurate and understandable subway car announcements improved, going from 85% in our last report to 90% in the current report. We found that: sixteen lines improved (1, 6, 7, A, B, C, E, F, G, J/Z, M, N, Q, R, V and W), two worsened slightly (D and L) and four remained unchanged (2, 3, 4 and 5).

What is happening here is clear: The subway lines that enjoyed a rollout of new R160s during 2008 saw marked improvements in their scores. The B and W— two lines showing improvements in the maintenance department — inherited newer cars when the Q and N received new cars. Meanwhile, the BMT Nassau St./Jamaica line trains (the J, M and Z) also were the recipients of new trains. Thus, those lines were nearly guaranteed improvements across the board.

Point six suffered from the same new train bias. The N, according to the Straphangers, had a breakdown rate nearly 200,000 miles above average. That’s because the R160s haven’t yet started to break down or even age yet. Instead of praising the line for its successes, the Straphangers should be praising the MTA for investing in new rolling stock.

In the end, this survey is what it is. We all know that it’s tough to get a seat at rush hour, that the antiquated public address system isn’t really adequate and that stations are both crowded and dirty. The real reasons for the improvements — new cars, new management programs and an unequal and unsustainable redistribution of cleaning services — make for a far more compelling story than the one the Straphangers told yesterday.

Comments (12)

The Straphangers Campaign released their annual State of the Subway survey this afternoon, and I’ll just provide you with a link to the results right now. I’ll have time to give some more analysis and thoughts on this survey later. The winners are the 7 and L, the two lines that were both under the auspices of the Line Manager pilot program in 2008. The C was the lowest rank line, unseating the W for that dubious distinction.

Comments (6)

As part of my series of posts questioning the current state of subway advocacy and news coverage, earlier this week, I, with an assist from Chris O’Leary at the fledgling site On Transport, questioned the effectiveness of the Straphangers Campaign in organizing against the most recent fare hikes and advocating for sensible funding solutions for mass transit in New York City.

The gist piece focused around how the Straphangers were seemingly a non-entity, content to release their annual State of the Subway and Subway Shmutz reports while not making their voices heard enough on the fare hikes. The comments to the post have turned into a lively debate with many readers taking my side and advocates from the Tri-State Transportation Campaign and Transportation Alternatives speaking out in defense of the Straphangers.

Late yesterday afternoon, Gene Russianoff, staff attorney for the Straphangers Campaign, responded, and I wanted to reproduce his comment in full. It was never my intention to criticize Mr. Russianoff himself. He has been a tireless subway champion for decades, but as the most vocal face of the Straphangers, he bore the brunt of my critique. Below is his response, and following that, my comments:

In the Second Avenues Saga blog for June 30th, you say the Straphangers Campaign was not “a force” in the recent fare hike. You quote someone who says “we sat on our hands.” That’s just not true. Below I lay out what we did and how it shaped the final outcome.

In December 2008, a State commission headed by former MTA Chairman Richard Ravitch issued a report laying out a program to provide the MTA with long-term stable funding, as well as providing incentives to use transit. The specific program called for $5 tolls on the currently “free” East and Harlem River Bridges, a far more modest fare hike than proposed by the MTA and a broad-based payroll tax imposed in the 12-county region served by the MTA. The message of the plan was simple: In a tough economy, transit needed help from those who benefited from the system: riders, drivers and businesses.

Also in December, the MTA proposed massive fare hikes – with the base fare going from $2.00 to $2.50 and the 30-day unlimited-ride MetroCard going from $81 to $103 – along with severe service cuts, including eliminating several subway lines and 20 bus routes.

Given the need for action, the Straphangers Campaign directed its efforts to educating the public on the need for new transit funding for the MTA. We did this in coalition, working with many other groups, including the Regional Plan Association, Tri-State Transportation Campaign, Transportation Alternatives, Environmental Defense Fund, the Natural Resource Defense Council and General Contractors Association.

The Fight

We did a great deal of work, as described in this list below. We think it worked. One State Senator – Bill Perkins of Harlem – said he had never received so many letters and calls on one issue as he had on the fare hike. We:

1. Helped raise widespread public awareness of what we called “the mother of all fare hikes” and the proposed service cuts. For example, we asked the New York City Independent Budget Office to review the original MTA proposals. The IBO concluded (correctly) that a 30-day unlimited-ride MetroCard would go from $81 to a shocking $103. In addition, we convinced MTA to release numbers of what the fare box ratio (the percentage of expenses borne by riders) would be if “Doomsday” budget were adopted. It turned out that the fare box burden on subway riders would grow from 68% to 83% of expenses; in comparison the national average for large systems is 37%, according to the Federal Transit Administration. Our fact sheets on the MTA’s finances our web site, http://www.straphangers.org/fare.

2. Distributed 150,000 education leaflets to subway and bus riders and commuters between November and May, educating riders about the MTA financial crisis, including both its operating and capital needs. Published two fact sheets, one on proposed service cuts, one on the proposed fare hike; distributed at fare increase hearings.

3. Organized turnout for five MTA fare increase/service cut hearings in winter, 2009, with a strong emphasis on specific cuts in service. MTA officials reported a doubling in attendance and testimony from the 2007 fare hearings. Distributed talking points fact sheet at hearing.

4. Held three mock “funerals,” protesting MTA proposal to kill G, M, W and Z lines; public officials participated. The funerals included a bagpipe player, a wreath and eulogies.

5. Sent out 20 global e-mails to Straphangers e-mail list of 18,000. Posted breaking events and news clippings on Campaign website. Global emails were also send to our “fans” on Facebook.

6. Helped direct several events, including a rally in Union Square conducted with a group mounting a transit funding campaign on Facebook.

7. Talked with dozens of decision-makers and spent many days in Albany. Testified at hearing on Ravitch plan held by New York State Senate members Martin Malave Dilan and Bill Perkins.

8. Helped lead the effort for a $125,000 media outreach campaign with an ad on 3,000 subway cars for one month. (The ad can be found at: http://www.mrss.com/clients/kn…..300ppi.pdf )

9. Testified during 17 public comments periods at MTA Board and committee meetings; held a dozen protests at MTA Board meetings.

10. Collected over 1,000 handwritten letters addressed to State Senators, Assembly Members and other State leaders.

The Outcome

In early May, the State adopted an MTA “bailout” program worth $1.8 billion annually. In many ways, it tracked the Ravitch program. Both plans called for $1.5 billion in a new payroll “mobility” tax; both called for a moderate fare increase; and both called for new taxes and fees on automobile use.

It is in this last part of the adopted plan that it differs from the Ravitch Commission proposal. Ravitch had called for a $5 toll on the East and Harlem River Bridges, although he had stated his support for a subsequent proposal for $2 tolls, which would have produced about $300 million annually. The final State bailout called for a similar amount of revenue from four sources: increased drivers license and registration fees, an increased automobile rental tax and a 50-cent taxicab drop off fee.

The impact on motor vehicle use of the tolls as opposed to the adopted measures is not fully known. That said, it is likely that it is not significant. In addition, the original plan for improved bus service – which included 300 new buses – was eliminated in the final plan.

Lastly, the final plan fully funds the MTA’s five-year capital program for only its first two years out of five. The issue will be back before the State, although the hope is that the economy will improve and that already-dedicated existing transit taxes will yield added revenues.

So there is a lot more transit work to do. And, as in the past, we – and others – will continue to do it.

Chris at On Transport received the same reply, and what he said in response rings true. “The issue here is not what was done (and I will gladly eat crow for being a bit dramatic in saying they “sat on their hands”), but what could have been done,” he writes.

O’Leary continued: “It’s fantastic that a State Senator received such an overwhelming number of letters. That’s proof that there is strength in numbers. But there are millions of transit riders each day in New York. When only a tiny fraction sign a petition or join a Facebook group, there is more that can be done. And that aside, there were a lot of people who were a little lost about what to do other than signing a petition or joining a Facebook group. ”

From personally experience, it took me five tries to get on the Straphangers’ press release distribution list. Their Web site doesn’t feature an updated selection of releases. In fact, it hasn’t been materially updated since the early 2000s. Outside of a Rider’s Diary forum, there is no interactivity, and in today’s world of powerful and positive online advocacy, the lack of a blog or similar social networking/social media component is a detriment.

As Lindsey Lusher Shute said in the comments to my earlier post, we could support the Straphangers by advocating with our check books. I appreciate the precarious financial position these small groups are in, but we need more than just money. We — Chris at On Transport and I here — are just two of the many people who, if asked, would contribute our time and energy to the cause.

Right now, we need groups that can reach more than just 18,000 of the 5.2 million subway riders a day. Maybe that beings with us; maybe it begins with the behind-the-scenes work the Straphangers are doing. Either way, the public face of transportation advocacy needs to be more vocal and wide-reaching than it is today for us to make headway against stubborn politicians and a willingly ignorant voter base.

Comments (8)
  • Extended Stay

    Featuring a wide range of sophisticated furnished apartments throughout the city and surrounding areas, ExecuStay can help you enjoy a New York extended stay that's both productive and relaxing.

  • Corporate Apartments

    As a resident of ExecuStay New York corporate apartments, you'll find that getting around is a snap, thanks to the many MTA subway lines, buses and yellow cabs.